July 18, 2026
Business Intelligence for Small Business: 2026 Guide
Discover how business intelligence for small business can boost revenue, cut reporting time by 80%, and improve decision-making for growth.

Business Intelligence for Small Business: 2026 Guide
TL;DR:
- Business intelligence helps small businesses make faster, more confident decisions by connecting and analyzing existing data sources.
- Most SMBs start with affordable SaaS tools and focus on building a solid data model before creating dashboards.
Business intelligence (BI) is defined as the practice of collecting, organizing, and analyzing your business data to make faster, more confident decisions. Small business owners who adopt BI reduce manual reporting time by about 80%, freeing hours every week for work that actually grows revenue. One 14-store retailer cut monthly report prep from three days to four hours after implementing BI. SMBs that commit to data-driven decision making report 15–20% revenue growth and cost reductions of 15–50% within three years. The tools are more affordable than most owners expect, and you do not need a dedicated data team to get started.
What does business intelligence for small business actually require?
Before you buy any software, answer one question: what decisions are you making right now without reliable data? That question defines your entire BI project. Common answers include “I don’t know which products are actually profitable” or “I can’t tell if my marketing spend is working.” Start there, not with a tool.

Most small businesses already have the raw data they need. The typical sources are a point-of-sale or ERP system, a CRM, accounting software like QuickBooks, and spreadsheets. The goal of BI is to connect those sources into one place so you stop toggling between five tabs to answer a single question.
Self-service BI tools now dominate the market, with 70% of enterprises using them in 2026. The SMB segment is the fastest-growing part of a market that reached $54.9 billion in 2026. That growth has pushed prices down significantly.
Here is a realistic cost picture for small business owners:
- Entry-level SaaS BI tools: $800–$2,600 per year, cloud-based, drag-and-drop interfaces
- Starter dashboards (professionally built): $12,000–$30,000 one-time build cost
- Modeled BI layers with full data architecture: $30,000–$90,000 build cost
- Ongoing cloud and maintenance fees: 15–25% of build cost annually, plus $400–$3,000 per month in cloud fees
Most small businesses start with a SaaS tool and a small number of dashboards. That is the right call. You can always add complexity later once you know what questions matter most.
Pro Tip: Pick a tool with native connectors to your existing software. A tool that connects directly to QuickBooks and your CRM saves weeks of setup time and avoids custom integration costs.
Why your data model matters more than your dashboard
The most common mistake in BI projects is spending 90% of the budget on dashboards and 10% on the data underneath them. The correct ratio is the reverse. A data model represents 90% of the real work in any BI project. Dashboards are just the display layer on top.
Here is why that matters in practice. If your sales team defines “active customer” as anyone who bought in the last 12 months, but your finance team defines it as anyone who bought in the last 90 days, your dashboards will show two different numbers for the same metric. Neither team trusts the data. Decisions stall. That is spreadsheet chaos, and it is the most common reason BI projects fail.
A proper data model solves this by establishing one agreed definition for every key metric before any dashboard gets built. The standard architecture for SMBs looks like this:
- Extract, Load, Transform (ELT) pipeline: Pull raw data from your sources (CRM, ERP, accounting) into a central location automatically.
- Cloud data warehouse: Store all your data in one place. Common options include cloud-based warehouses that charge based on storage and query volume.
- Transformation layer: Apply your business rules here. This is where “active customer” gets defined once and used everywhere.
- Semantic layer: Translate technical field names into plain language so any team member can build a report without knowing SQL.
- Dashboard layer: Build your charts and KPIs on top of this clean, consistent foundation.
This architecture follows the “buy the core, build the edge” principle. Buy standard warehouse and BI tools. Custom-build only the dashboards that are genuinely unique to your business. That approach keeps costs down and lets you swap tools later without losing your data model.
Pro Tip: Write down your metric definitions in a shared document before you build anything. A one-page “data dictionary” with definitions for revenue, margin, and customer counts prevents months of confusion later.
How to implement BI in your small business step by step
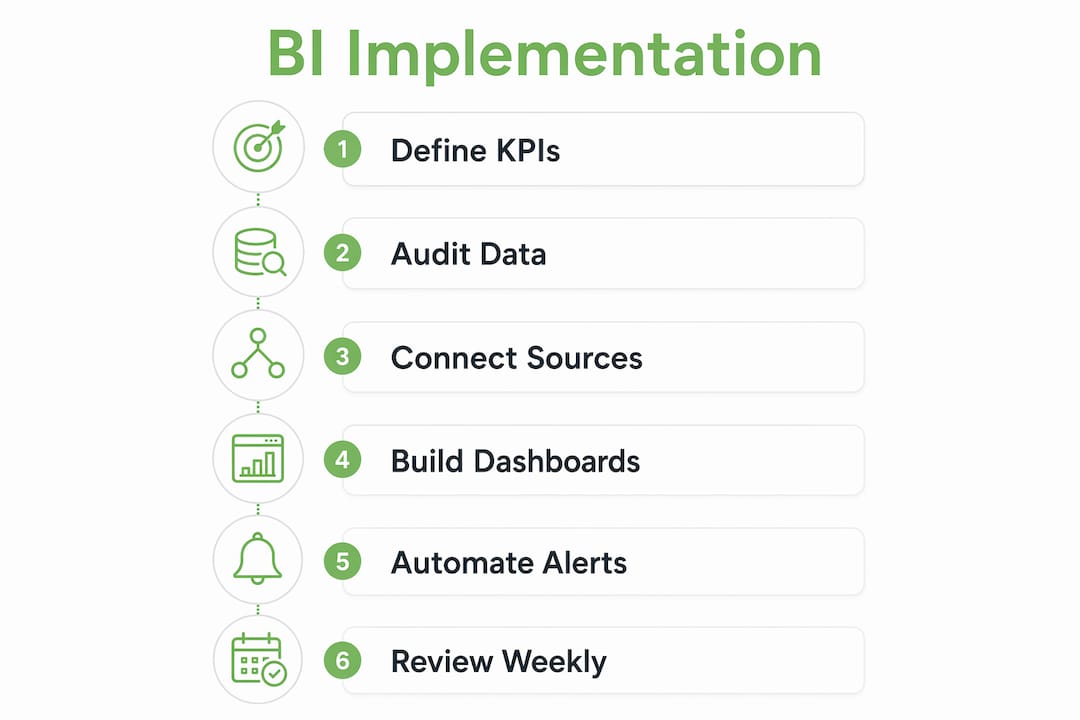
A typical SMB BI project runs 2–4 weeks for starter dashboards and 6–12 weeks for a full modeled BI layer. Data cleanliness is the biggest variable. Dirty data adds weeks. Here is how to move through the process without losing momentum.
Step 1: Define your 6–8 core KPIs
Start with 6–8 KPIs that reflect your business health. Tracking too many metrics too early reduces your ability to act on any of them. Good starting KPIs include monthly revenue trend, gross margin by product, sales pipeline value, customer acquisition cost, and cash runway. Pick the ones that match your biggest current decisions.
Step 2: Audit and clean your data sources
Pull a sample from each source and check for duplicates, missing fields, and inconsistent naming. A product called “Widget A” in your ERP and “widget-a” in your CRM will cause problems. Fix these issues before connecting anything to a BI tool.
Step 3: Connect your sources and build your model
Use your chosen BI tool’s native connectors to pull data from your ERP, CRM, and accounting software. Build your transformation layer to apply consistent definitions. This step takes the most time, but it is the foundation everything else rests on.
Step 4: Build your starter dashboards
Build one dashboard per major business function: sales performance, financial health, and operational efficiency. Keep each dashboard to 4–6 charts. A clean, simple dashboard that gets used every day beats a complex one that nobody opens.
Step 5: Set up automated refresh and alerts
Configure your data to refresh automatically, daily at minimum. Set threshold alerts for critical metrics: for example, alert when gross margin drops below 40% or when cash runway falls below 60 days. Alerts turn your BI system from a reporting tool into an early warning system.
Step 6: Build a data-driven meeting habit
Schedule a weekly 30-minute review of your dashboards with your key team members. Involving your sales and operations teams in selecting KPIs builds ownership and improves adoption. Teams that help choose the metrics they track are far more likely to act on them.
You can explore how AI-powered decision making fits into this process once your data foundation is solid.
What mistakes kill small business BI projects?
Most BI projects that fail do so for predictable reasons. Knowing them in advance puts you ahead of the majority of small business owners who attempt this.
- Skipping the data model. Building dashboards on top of raw, uncleaned data produces charts that look great and mean nothing. Always model first.
- Underestimating data cleaning time. Owners consistently assume their data is cleaner than it is. Budget at least 30% of your project timeline for data cleanup alone.
- No stakeholder involvement. A BI system built by one person for everyone else rarely gets used. Bring your team into the process early.
- Chasing too many metrics. A dashboard with 40 KPIs is not more useful than one with 8. It is less useful. Focus creates action.
- Ignoring ongoing maintenance. BI is not a one-time project. Data sources change, business questions evolve, and dashboards need updates. Budget for ongoing maintenance from day one.
The businesses that get the most from BI treat it as a governance project, not a technology project. The goal is one trusted source of truth that every team uses to make decisions. The tool is secondary to the discipline.
An operational efficiency checklist can help you identify which processes are ready for data-driven improvement before you build your first dashboard.
Key Takeaways
Small businesses that build their BI on a solid data model, start with a focused set of KPIs, and involve their teams early see the fastest and most durable results.
| Point | Details |
|---|---|
| Data model first | 90% of BI project value comes from the data model, not the dashboard layer. |
| Start with 6–8 KPIs | Tracking fewer metrics drives faster decisions and better team adoption. |
| Budget realistically | Starter dashboards cost $12,000–$30,000 to build; SaaS tools start at $800/year. |
| Involve your team early | Teams that choose their own KPIs adopt BI tools faster and use them consistently. |
| Treat BI as ongoing | Budget 15–25% of build cost annually for maintenance, updates, and new data sources. |
Why I think most small businesses approach BI backwards
After working with dozens of small business owners on data projects, I keep seeing the same pattern. An owner gets excited about a beautiful dashboard they saw at a conference or in a demo. They buy the tool, connect a few spreadsheets, and build charts. Six months later, nobody is using it. The data does not match what the finance team sees. The sales team does not trust the numbers. The project quietly dies.
The problem is not the tool. The problem is that the owner started at the end. Dashboards are the last 10% of the work. The first 90% is unglamorous: defining your metrics, cleaning your data, and building a model that everyone agrees on. That work does not look impressive in a demo, but it is the only thing that makes the dashboard mean something.
The businesses I have seen get real results from BI share one trait. They treated it as a governance project before they treated it as a technology project. They sat down with their finance, sales, and operations people and asked: “What does ‘revenue’ mean to each of you?” The answers were always different. Fixing that gap, before touching any software, is what separates a BI project that transforms a business from one that collects dust.
SMBs have the most to gain from BI because every wrong decision hits harder and faster than it does at a large company. That is not a reason to be cautious about BI. It is a reason to do it right the first time.
— Kevin
How Swipecredit helps small businesses get real results from their data
Swipe Credit AI helps teams turn permissioned business data into clearer opportunities and measurable economic outcomes while keeping people in control. Access and available capabilities depend on the selected plan and connected systems.
Swipe Credit AI helps teams reveal valuable business opportunities, act with greater clarity, and measure outcomes while keeping people in control.
FAQ
What is business intelligence for small businesses?
Business intelligence for small businesses is the practice of connecting your existing data sources, such as your CRM, accounting software, and sales system, into one place to generate reports and dashboards that support faster decisions. It does not require a data team or enterprise budget to get started.
How much does BI cost for a small business?
SaaS BI tools start at $800–$2,600 per year, while professionally built starter dashboards typically cost $12,000–$30,000. Ongoing maintenance runs 15–25% of the build cost annually, plus cloud fees of $400–$3,000 per month depending on data volume.
How long does it take to implement BI in a small business?
Starter dashboards take 2–4 weeks to implement. A full modeled BI layer with proper data architecture takes 6–12 weeks. Data quality is the biggest factor: cleaner data means faster implementation.
What KPIs should a small business track first?
Start with 6–8 KPIs that reflect core business health: monthly revenue trend, gross margin by product, sales pipeline value, customer acquisition cost, and cash runway. Tracking fewer metrics produces faster, clearer decisions than tracking everything at once.
What is the biggest reason BI projects fail for SMBs?
The most common failure is building dashboards before building a proper data model. Without consistent metric definitions and clean, connected data, dashboards produce numbers that different teams interpret differently, and the system loses credibility quickly.